Dive in: Monthly Bay Area Transportation Stats
MTC’s Monthly Transportation Statistics show a comprehensive picture of transit and transportation in the Bay Area.
See monthly figures on crossings for all seven of the Bay Area’s state-owned bridges, as well as weekday BART trips, Clipper® card data, and response times and the number of assists by the Freeway Service Patrol. Site visitors can see and analyze mobility trends across different transportation modes.
Compare, for example, the traffic on the San Francisco-Oakland Bay Bridge. In February 2024, 3.3 million vehicles crossed the bridge – 94.28% of the 3.5 million vehicles that crossed in February 2019.
Or look at the number of crossings on the other Bay Area state-owned bridges: 6.3 million in February 2024, compared with 6.9 million vehicles in February 2019 – 91.3% of pre-pandemic traffic.
While the number of crossings fluctuates from month to month, the overall number of Bay Area bridge crossings has been trending upward, actually exceeding pre-pandemic levels in summer 2023.
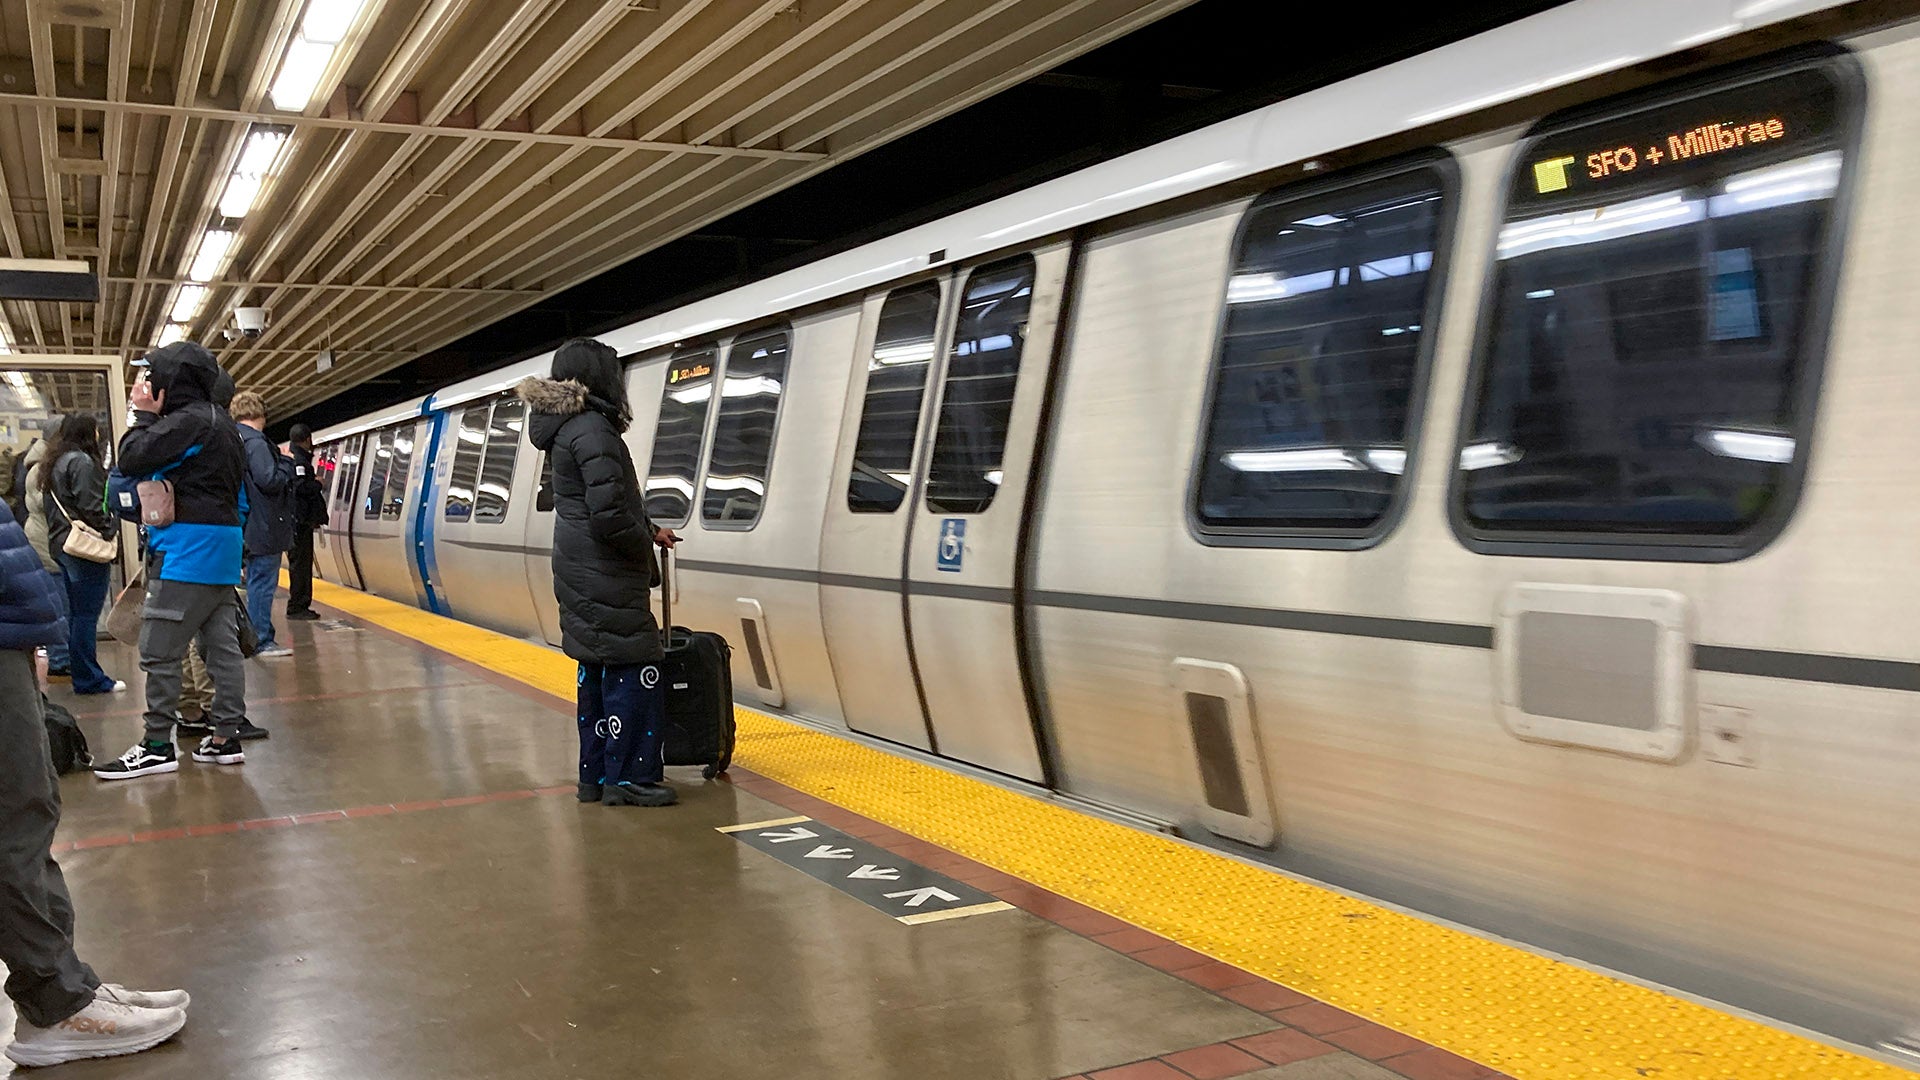
On the other hand, BART travel continues to be well below pre-pandemic ridership levels. February 2019 saw 407,337 riders, while February of this year saw less than half (162,186) of those trips.
Dive in to the data for your own analysis. The figures on the Monthly Transportation Statistics web page are updated by mid-month, when data become available.
Submit your comment
In order to receive a reply to your comment, please provide an email address.