Report to the Commission: November 18, 2015
“Big 4” MPO Meeting
Sacramento, November 3
I met with my counterparts at metropolitan planning organizations (MPOs) serving San Diego, Los Angeles, and Sacramento to swap war stories as we all process our second round of Sustainable Community Strategies (SCS). On the good news front, San Diego has completed its second plan, exceeded its greenhouse gas reduction targets, and cleared the CEQA litigation deadline with no lawsuits filed. The Bay Area will bring up the rear as we did with the first cycle of plans: we are not scheduled to adopt the update to Plan Bay Area until summer 2017.
House Approves Reauthorization Bill
Washington DC, November 5
In Act I of the federal surface transportation reauthorization melodrama playing out in our nation’s capital, the U.S. Senate approved the DRIVE Act earlier this year, a six-year bill with only three years’ worth of funding. In Act II, the House has approved the less-memorably-named Surface Transportation Reauthorization and Reform (STRR) Act which originally appeared to be heading toward the same funding disconnect as the Senate bill: a six-year bill that was only half-funded.
At the last moment before final House passage, Rep. Randy Neugebauer (R-TX) secured passage of an amendment that raided the Federal Reserve capital surplus account to the tune of $40 billion in net new revenue that would be available as a “pay for” to support higher transportation spending in the STRR bill. Former Fed chairman Ben Bernanke has deplored this budgetary sleight-of-hand in an essay published by the Brookings Institution.
Now we move to Act III of surface transportation reauthorization: the conference committee. While there are plenty of differences between the two bills to reconcile in conference, the only difference that really matters is that the House has found $40 billion in additional budget authority to spend. If that amount were to be applied to a six-year bill, it would at least approximate current spending levels over the entire authorization period. If, however, that additional $40 billion were applied to a shorter five-year or four-year bill, the annual spending levels would consequently be much higher. U.S. Transportation Secretary Anthony Foxx has sent the Congress a letter advocating for higher funding levels. Meanwhile, the House has passed by voice vote a bill to extend the current authorizing law through December 4th to give the conference committee more time to do its work. The Senate is shortly expected to follow suit.
Roadmap for Economic Resilience
San Francisco, November 6
Commissioner Halsted and I attended the launch event for the unveiling of the regional economic development strategy that was produced by the Bay Area Council Economic Institute and funded by MTC. I participated in a panel discussion about the transportation recommendations in the report moderated by Alex Mehran, CEO of Sunset Development Company.
U.S. 101 Corridor Initiative
San Francisco, November 10
Commissioner Sartipi, Andy Fremier and I attended a leadership meeting convened by California Transportation Secretary Brian Kelly to discuss the various plans that have been floated to widen U.S. 101 in San Mateo County with either an HOV or HOT lane. Secretary Kelly used the meeting to introduce former Caltrans Director Tony Harris, whom Kelly has appointed to try to forge consensus on a set of multi-modal corridor improvements that can be pursued in the near-term. There is intense interest in these projects from some of the major tech firms in Silicon Valley; the meeting was held at Google’s San Francisco offices.
Bay Area Planning Directors Association
Oakland, November 13
Ken Kirkey and I joined Ezra Rapport and Miriam Chion at this meeting of local planning directors from throughout the region to update them on the issues related to planning department integration and the MTC/ABAG merger study.
MTC is MPO of the Year
I am extremely proud to report that MTC received the 2015 award for “Outstanding Overall Achievement for a Large MPO” from the Association of Metropolitan Planning Organizations at their annual meeting last month in Las Vegas.
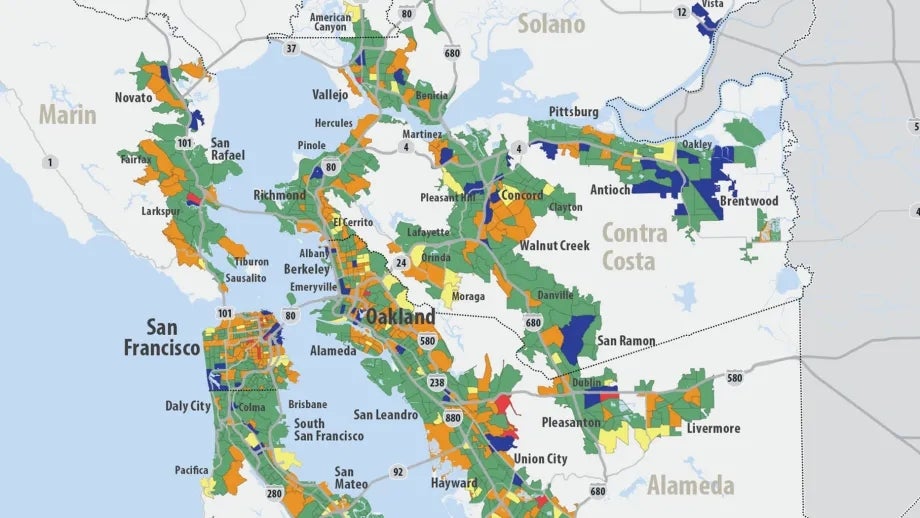
Change in Low to Moderate Income Renters by Tract, 2000-2013
This map depicts that the region added 114,317 low- and moderate-income renters between 2000 and 2013 (or 72 households per census tract on average). But the distribution of these new and existing households was not uniform across the region. Census tracts that gained low- and moderate-income renters (green and blue on the map) were largely in more suburban areas of the region. Census tracts that lost a substantial number of low- and moderate-income renters (orange to red on the map), though concentrated in more urban areas, also are spread across the region, highlighting the fact that potential displacement of lower-income renter households is not just a 3-big-cities issue. Low-income renters is defined as households earning less than 80% of the county median income, and moderate-income renters as earning less than 120% county median income.

