Fresh Data on Bay Area’s Vital Signs Show Big Jump in Freeway Congestion for 2015
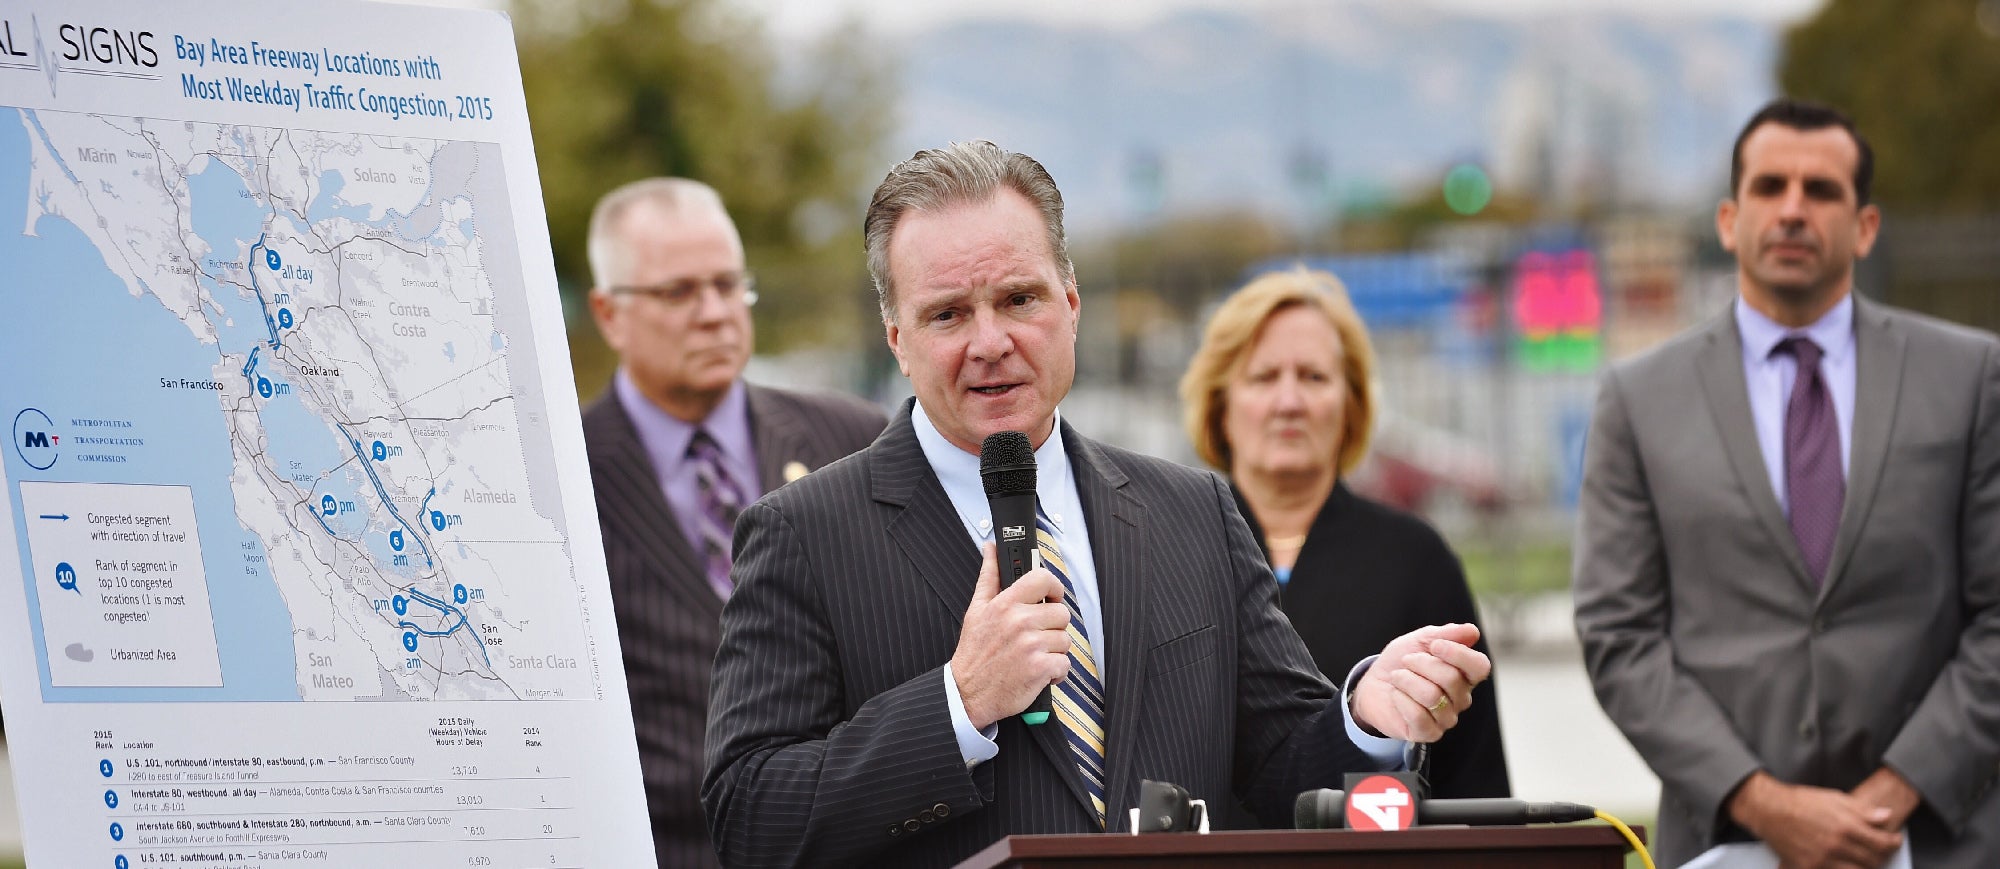
The Metropolitan Transportation Commission (MTC) today unveiled its annual ranking of the Bay Area’s most congested freeway segments, with the afternoon drive on northbound U.S. 101 and eastbound Interstate 80 in San Francisco supplanting the morning commute along westbound I-80 from Hercules to San Francisco as the region’s most notorious location for traffic trouble. The roughly six-mile stretch from the U.S. 101/ Interstate 280 interchange out to the Bay Bridge’s Yerba Buena Island Tunnel ranked #4 on the regional congestion list for 2014. Despite falling to #2 on the 2015 list, the westbound I-80 drive from State Route 4 in Hercules to U.S. 101 in San Francisco made history with congested conditions typically extending from 5:35 a.m. to 7:50 p.m. This is the first time routine congestion on any Bay Area freeway segment has not been interrupted by a mid-day break.
The congestion data is one of many transportation, population, employment and housing indicators released today as part of MTC’s web-based Vital Signs performance-monitoring initiative (www.vitalsigns.mtc.ca.gov). Across the region, “congested delay,” which MTC defines as time spent in traffic moving at speeds of 35 miles per hour or less, surged 22 percent in 2015 to an average of 3.2 minutes per commuter each weekday from 2.7 minutes in 2014. This marks the Bay Area’s highest recorded level of congested delay on a per-commuter basis and a nearly 70 percent increase over the 1.9-minutes-per-commuter-per-day figure registered in 2010.
Seven of the region’s 10 most congested freeway segments in 2015 ranked in the Top 10 for 2014 as well. Newcomers to the list include the morning commute along southbound Interstate 680 and northbound Interstate 280 from East San Jose to Cupertino, which climbed to #3 last year after ranking #20 in 2014; the northbound afternoon drive on Interstate 880 from Fremont to Hayward, which rose to #9 from #16; and the afternoon commute on northbound U.S. 101 from Menlo Park to Foster City, which rose two spots to #10 from #12 in 2014.
The remainder of the Top 10 list includes the afternoon slog on southbound U.S. 101 from Sunnyvale to South San Jose, which fell one spot to #4 last year after ranking #3 for two years in a row; the afternoon commute on eastbound I-80 from the Bay Bridge toll plaza area to Albany, which climbed two spots to #5; the morning drive on southbound I-880 from San Leandro to Milpitas, which slipped to #6 last year from #2 in 2014; and the morning crawl northbound on U.S. 101 from South San Jose to Sunnyvale, which rose two spots to #8.
“The congestion data really underscore both the robust job growth we’ve seen in the South Bay and San Francisco, and the persistent imbalance between where those jobs are located and where comparatively affordable housing can be found,” explained Santa Clara County Supervisor and MTC Chair Dave Cortese. “Routes leading into or out of Silicon Valley and San Francisco dominate the Top 10, and they account for almost half of all congestion in the region.”
“We all feel the impacts of traffic congestion in our daily commutes,” said San Jose Mayor and MTC Commissioner Sam Liccardo. “But today’s data starkly demonstrates how quickly we need to invest in real solutions that can provide congestion relief – expanding mass transit, improving our roads and highways, and more.”
Other newly released 2015 Vital Signs include:
- Population: The Bay Area’s population rose to 7.6 million by the end of 2015, with about one out of every four residents living in Santa Clara County;
- Employment: Bay Area employment hit an all-time high of 3.7 million in 2015, with nearly half of the region’s jobs located in San Francisco or Silicon Valley;
- Housing: Permitting of new units continues to run well below 1970s and 1980s levels, despite a much larger 2015 population and a deepening affordability crisis;
- Miles Traveled in Congestion: 94 percent of the Bay Area’s total freeway mileage was traveled in free-flow or moderate-flow conditions last year, down a percentage point from 2014;
- Travel Time Reliability: Despite rising congestion, travel times during peak periods have seen minimal changes in day-to-day reliability since 2010;
- Transit Asset Condition: Nearly 30 percent of the region’s buses, railcars, tracks and other transit assets are past their useful life. With 71 percent of its fleet past its useful life, BART’s maintenance needs dwarf those of other transit agencies; and
- Particulate and Ozone Concentrations: While Bay Area air quality has improved markedly over the decades, adverse weather conditions linked to the drought caused regional particulate and ozone concentrations to increase slightly in 2015.