Each month a new map is presented to the Commission to help explain important trends in the Bay Area, across the nation and around the world. These custom-crafted maps are prepared by MTC’s Data & Visualization team.
Each month a new map is presented to the Commission to help explain important trends in the Bay Area, across the nation and around the world. These custom-crafted maps are prepared by MTC’s Data & Visualization team.

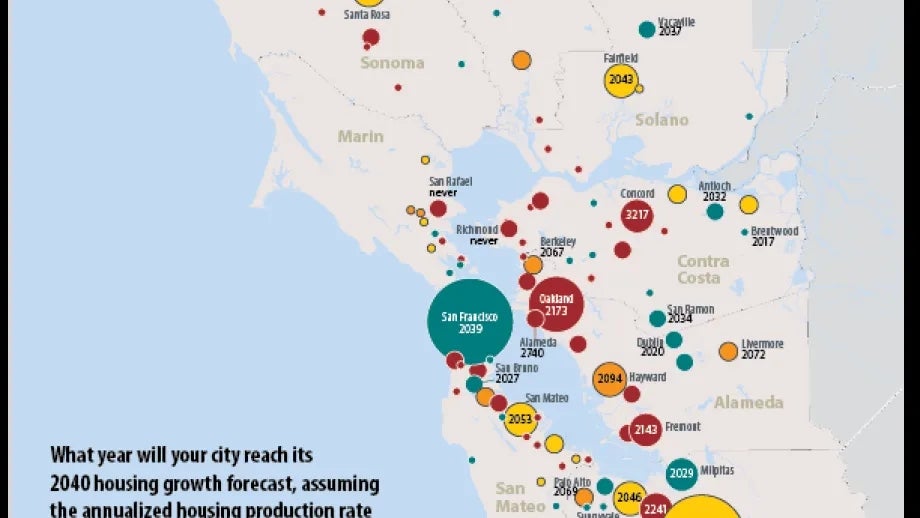
Bay Area housing production accelerated in 2014, reflecting an ongoing recovery of the region’s housing market. Yet this recovery remains uneven, according to an MTC analysis of California Department of Finance data. In order to get a sense of how actual city housing production compares to the Plan Bay Area forecasts, this map was developed to indicate the year a city would be expected to reach its 2040 housing unit projection in the Plan – assuming that the city’s 2014 housing production rate continues unabated over the coming years. Notably, the region’s two largest cities, San Jose and San Francisco, are on track to produce the level of housing envisioned in Plan Bay Area – if their relatively rapid year 2014 housing production rate continues in the years to come. The results are more mixed in the East Bay. Communities such as Dublin, Brentwood, and Antioch producing housing much faster than envisioned in the Plan; in stark contrast, inner East Bay communities like Oakland and Fremont would not meet their 2040 housing forecast until the mid-to-late-2100s at their current rate of production.