Each month a new map is presented to the Commission to help explain important trends in the Bay Area, across the nation and around the world. These custom-crafted maps are prepared by MTC’s Data & Visualization team.
Each month a new map is presented to the Commission to help explain important trends in the Bay Area, across the nation and around the world. These custom-crafted maps are prepared by MTC’s Data & Visualization team.

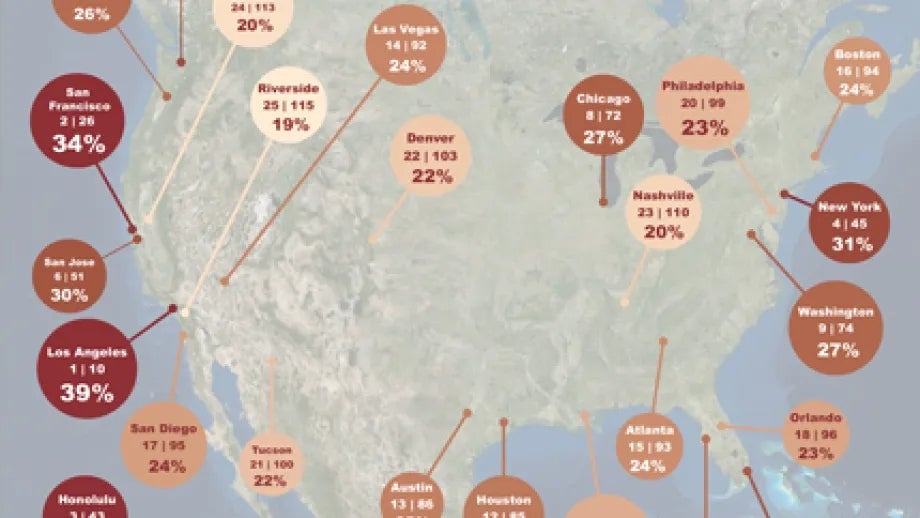
According to a recent report released by TomTom, drivers during the rush hour commute can expect congestion levels to significantly increase their commute time. On average, drivers will spend double the time in the car for most large metropolitan areas across the world during the evening commute alone. The average commuter spent an extra 100 hours a year traveling during the evening rush hour. In Los Angeles (Ranked 1st in the U.S. and 10th Worldwide), a 30 minute commute in the evening will take 54 minutes due to congestion, an extra 92 hours annually. Commuters in the Bay Area are only slightly better off than their counter parts in LA. The measured congestion in San Francisco (Ranked 2nd in the U.S. and 26th Worldwide) is at 34%, while San Jose (Ranked 6th in the US and 51st Worldwide) is at 30%. TomTom roadway congestion is measured as an increase in overall travel times when compared to the posted speed limits on roadways. For example, a Congestion Level of 12% corresponds to 12% longer travel times. The full report and press release can be viewed here: http://www.tomtom.com/en_gb/trafficindex/#/about