Each month a new map is presented to the Commission to help explain important trends in the Bay Area, across the nation and around the world. These custom-crafted maps are prepared by MTC’s Data & Visualization team.
Each month a new map is presented to the Commission to help explain important trends in the Bay Area, across the nation and around the world. These custom-crafted maps are prepared by MTC’s Data & Visualization team.

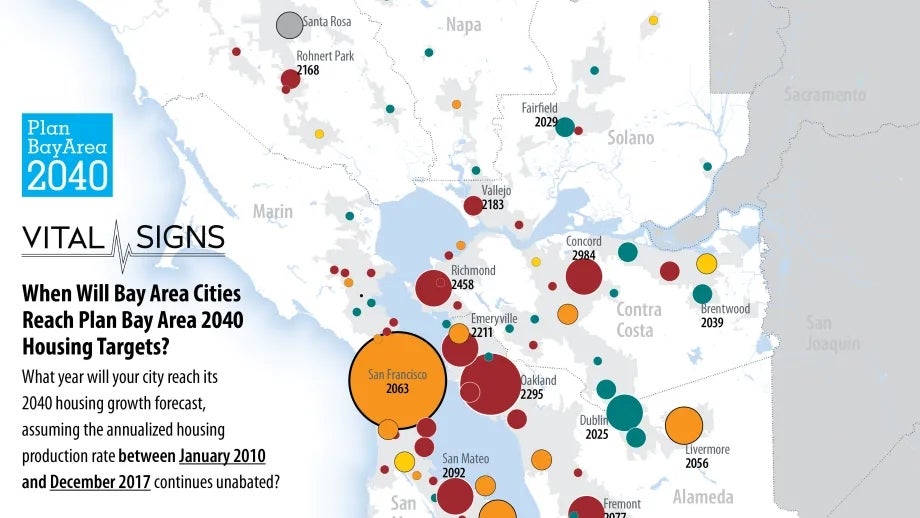
To beat a dead horse, May’s Map of the Month highlights the continued housing production challenges in the Bay Area, comparing Department of Finance housing production data between January 2010 and December 2017 with the Plan Bay Area 2040 housing forecasts by jurisdiction. This month's map shows the year that each city or town would meet its Plan Bay Area 2040 housing growth forecast if it continues on its recent production trajectory, during this lengthy economic expansion. Not surprisingly, most jurisdictions are lagging the Plan’s housing goals – meaning that the region won’t reach its 2040 housing goal until 2072 at the current pace. Notable bright spots for housing production include: Dublin, Pleasanton, and San Ramon in the Tri-Valley; Pittsburg and Brentwood in eastern Contra Costa County; Fairfield in Solano County; and Gilroy and Morgan Hill in southern Santa Clara County. Of the big three cities, San Francisco and San Jose are somewhat behind where they need to be, while Oakland would not reach its 2040 housing goal until 2295 given its pace of development since 2010. Additional analyses on housing trends through 2017 will be publicly released on the Vital Signs performance monitoring website next month.