Each month a new map is presented to the Commission to help explain important trends in the Bay Area, across the nation and around the world. These custom-crafted maps are prepared by MTC’s Data & Visualization team.
Each month a new map is presented to the Commission to help explain important trends in the Bay Area, across the nation and around the world. These custom-crafted maps are prepared by MTC’s Data & Visualization team.

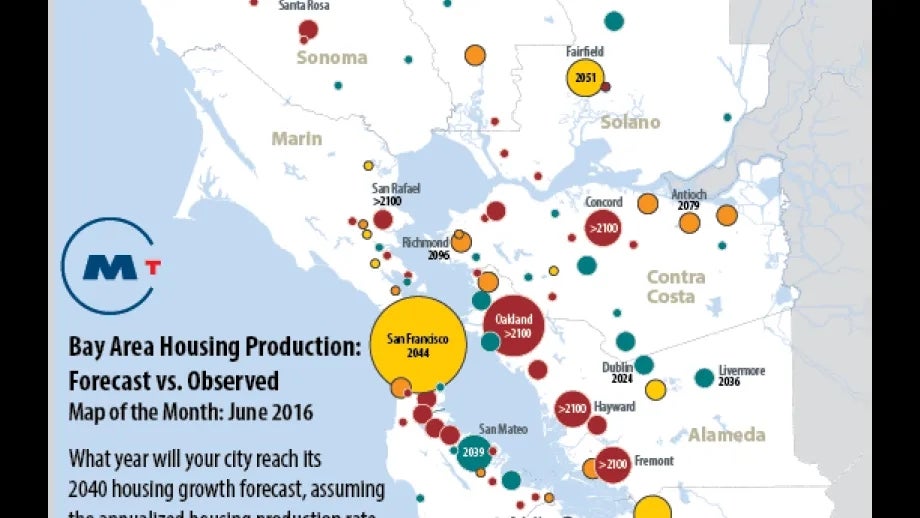
This map depicts housing production performance for Bay Area jurisdictions between January 2010 and December 2015, and housing production over the past year. Key conclusions are summarized below: Based on the last six years of growth, the region won't hit its overall 2040 housing target until 2065. By contrast, the 2015 number of total jobs (4.0 million) has occurred five years ahead of the forecasted schedule. Only a quarter of the region's cities are on track to achieve their 2040 housing targets. Approximately one-third of the region's cities won't achieve their 2040 housing targets until 2100 or later based on their six-year housing production rates. Housing production rates in the Big 3 cities dipped slightly in 2015. While San Francisco continues to be on track to meet its forecasted housing level, San Jose will not meet its target until after 2060 if it continues the 2015 housing production rate. The housing situation in Oakland won't achieve its 2040 housing target until the late 2100s given its worsened trajectory.