Each month a new map is presented to the Commission to help explain important trends in the Bay Area, across the nation and around the world. These custom-crafted maps are prepared by MTC’s Data & Visualization team.
Each month a new map is presented to the Commission to help explain important trends in the Bay Area, across the nation and around the world. These custom-crafted maps are prepared by MTC’s Data & Visualization team.

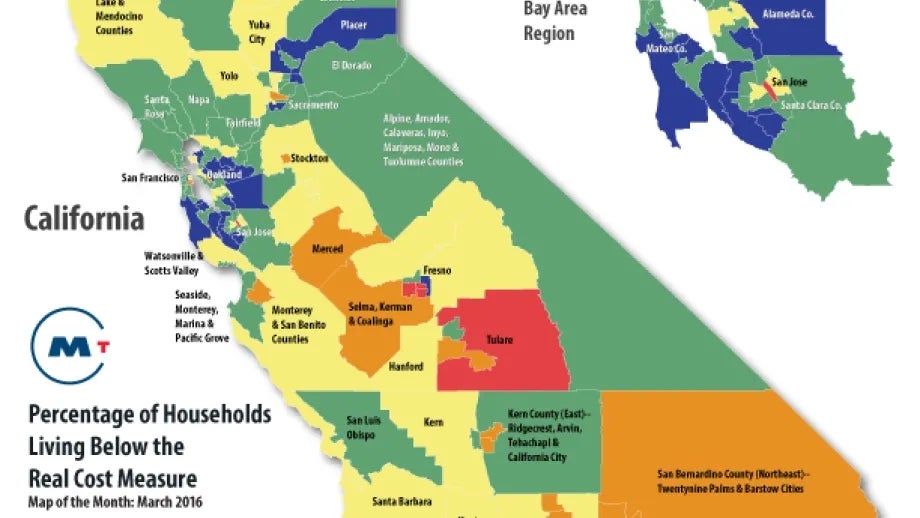
This map depicts the real costs of living in California's communities, as defined by a recent report released by the United Way of California titled: Struggling to Get By. Key findings in this report show that one in three California households (31%) do not have sufficient income to meet their basic costs of living. This is nearly three times the number officially considered poor according to the Federal Poverty Level. Families with inadequate incomes are found throughout California, but are most concentrated in the northern coastal region, the Central Valley, and in the southern metropolitan areas.The costs for the same family composition in different geographic regions of California also vary widely. In expensive regions such as the San Francisco Bay Area and the Southern California coastal region, the Real Cost Budget, a monthly budget calculation of what is needed to meet basic needs, can range from 32% to 48% more (depending on family type) than in less expensive counties such as Kern, Tulare, and Kings counties. Nevertheless, incomes in the higher cost regions are also higher, relatively and absolutely, so that the proportions below the Real Cost Measure are generally lower in high-cost thanlow-cost regions.