Each month a new map is presented to the Commission to help explain important trends in the Bay Area, across the nation and around the world. These custom-crafted maps are prepared by MTC’s Data & Visualization team.
Each month a new map is presented to the Commission to help explain important trends in the Bay Area, across the nation and around the world. These custom-crafted maps are prepared by MTC’s Data & Visualization team.

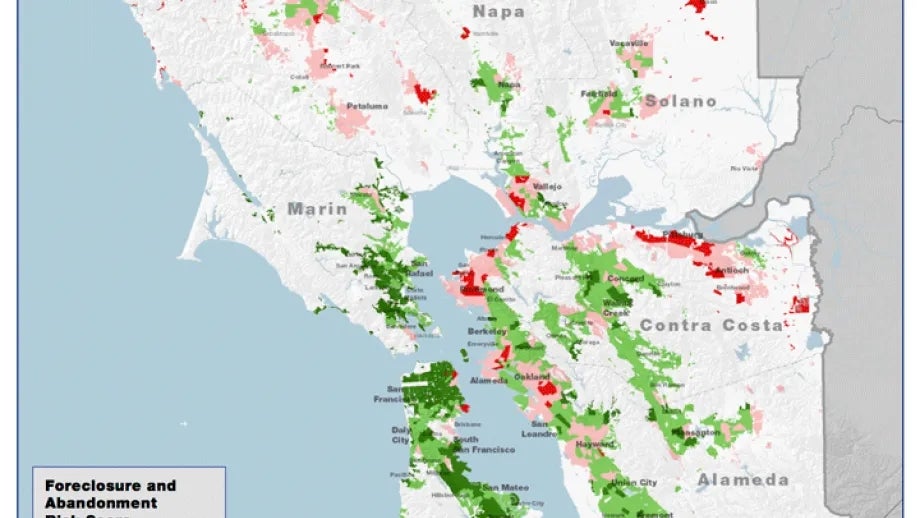
In 2008, the Department of Housing and Urban Development (HUD) created a Neighborhood Stabilization Program to provide emergency assistance to state and local governments to acquire and redevelop foreclosed properties that might otherwise become sources of abandonment and blight within their communities. This program provides grants to every state, certain local communities, and other organizations to purchase foreclosed or abandoned homes and to rehabilitate, resell, or redevelop these homes in order to stabilize neighborhoods and stem the decline of house values of neighboring homes. This map scores neighborhoods in the bay area on a scale of 1 to 20 where 20 indicates areas in the highest 20% of risk nationwide for home foreclosures and abandonment. 1 indicates areas with lowest risk. This ranking is based upon the following factors developed by HUD: whether or not loans are high cost or highly leveraged in the neighborhood change in home values for the metropolitan, or non-metropolitan portion of the state unemployment rate for the county in 2008, and the change in unemployment in the county between 2007 and 2008. HUD is providing its data on estimated foreclosures (based on risk) and vacancy data to assist state and local governments in their efforts to target the communities and neighborhoods with the greatest needs. HUD recommends that if states and local governments have local data, such as county data on foreclosure filings, that those data also be given serious consideration in identifying areas of greatest needs.Map Source: http://www.huduser.org/portal/datasets/nsp.html