Each month a new map is presented to the Commission to help explain important trends in the Bay Area, across the nation and around the world. These custom-crafted maps are prepared by MTC’s Data & Visualization team.
Each month a new map is presented to the Commission to help explain important trends in the Bay Area, across the nation and around the world. These custom-crafted maps are prepared by MTC’s Data & Visualization team.

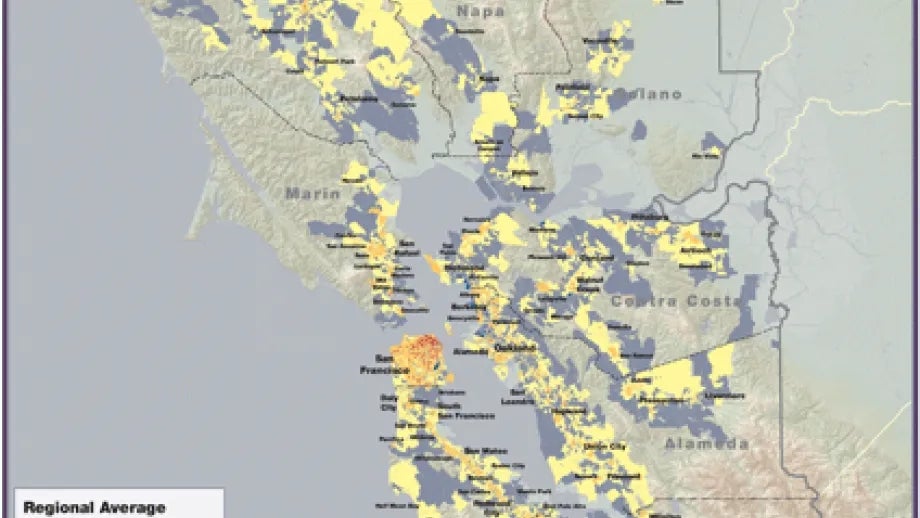
The map of the month shows a transportation availability index which is comprised of measures of auto availability in 2000, transit service frequency in 2009, and walkability in 2006. Standard scores were developed for each measure by census block. The standard score is expressed as the number of standard deviations away from the mean or average. A standard score value greater than 0 is above the regional average and indicates greater access to a combination of automobiles, transit and walking as viable transportation options.