Each month a new map is presented to the Commission to help explain important trends in the Bay Area, across the nation and around the world. These custom-crafted maps are prepared by MTC’s Data & Visualization team.
Each month a new map is presented to the Commission to help explain important trends in the Bay Area, across the nation and around the world. These custom-crafted maps are prepared by MTC’s Data & Visualization team.

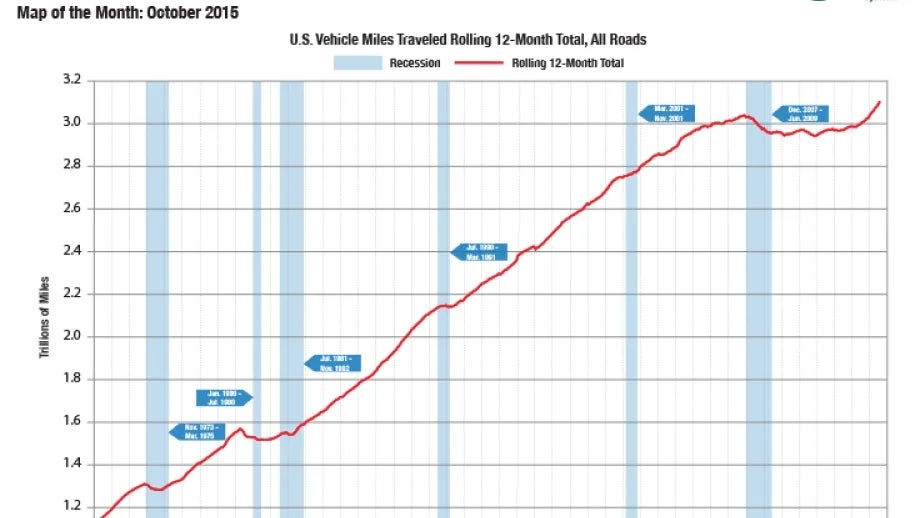
This graph shows the historical rolling 12-month total vehicle miles traveled on all roads starting in 1971. Vehicle miles traveled increased 4.2% year-over-year in July 2015, continuing an upward trajectory that started in March 2014. This ended an unprecedented five-year period of flat rolling 12-month totals following the ‘Great Recession’ of December 2007-June 2009. Cheaper gasoline prices likely account for some of the increase, with the national average per gallon declining from $3.69 in July 2014 to $2.88 in July 2015. The rebound of the national economy, increased job growth, and expanding population are additional factors.