Each month a new map is presented to the Commission to help explain important trends in the Bay Area, across the nation and around the world. These custom-crafted maps are prepared by MTC’s Data & Visualization team.
Each month a new map is presented to the Commission to help explain important trends in the Bay Area, across the nation and around the world. These custom-crafted maps are prepared by MTC’s Data & Visualization team.

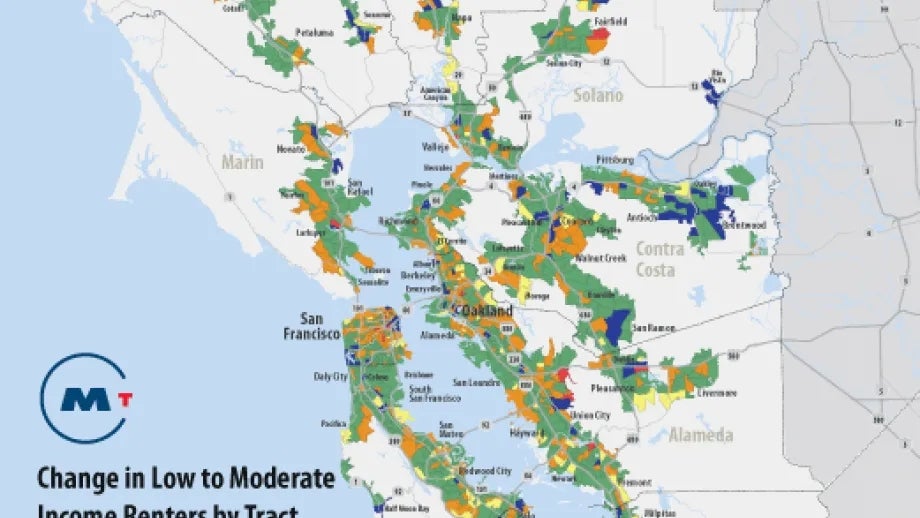
This map depicts that the region added 114,317 low- and moderate-income renters between 2000 and 2013 (or 72 households per census tract on average). But the distribution of these new and existing households was not uniform across the region. Census tracts that gained low- and moderate-income renters (green and blue on the map) were largely in more suburban areas of the region. Census tracts that lost a substantial number of low- and moderate-income renters (orange to red on the map), though concentrated in more urban areas, also are spread across the region, highlighting the fact that potential displacement of lower-income renter households is not just a 3-big-cities issue. Low-income renters is defined as households earning less than 80% of the county median income, and moderate-income renters as earning less than 120% county median income.