Multi-Agency Study Examines Transit Needs in San Francisco’s Employment Core
A new report by MTC along with six Bay Area public transit agencies finds that transit serving San Francisco’s primary employment centers experienced growth exceeding even the most aggressive forecasts over the last 10 years, and that ridership is expected to continue growing in the future. The region’s transportation infrastructure is already past physical capacity during peak travel periods and will be unable to accommodate anticipated future riders without significant new transportation investments.
The report is part of the Core Capacity Transit Study (CCTS), a collaborative, multi-agency effort to identify and prioritize investments that will improve public transportation to and from the San Francisco core. It confirms what many riders have experienced first-hand in recent years: The trains are packed, the streets and highways are congested, and the transportation system is stretched to its limits.
- BART: Average weekday BART ridership grew 36 percent from 2005 to 2015, from approximately 310,700 passengers to 423,100. Daily exits from the four downtown San Francisco BART stations grew 40 percent over the same period. Peak direction transbay trains during the morning and evening rush-hours often carry more than 115 passengers per car, exceeding BART’s standard maximum of 107 passengers per car, and sometimes go as high as 140 passengers per car. BART projects that daily ridership will increase by 25 percent to nearly 500,000 by 2025 and by 50 percent to 600,000 by 2040.
- San Francisco Municipal Transportation Authority (Muni): Muni is the region’s most-used transit system, carrying an average of 720,400 passengers per weekday in the 2013-14 fiscal year. Ridership has grown by 5.6 percent in the last decade, and morning peak-hour ridership in the Market Street tunnel has grown by one-third in the last five years, from 6,400 in 2010 to 8,550 in 2015. Several Muni Metro lines are at capacity during peak travel times.
- AC Transit: Morning San Francisco-bound ridership on AC Transit’s transbay routes grew nearly 40 percent between 2010 and 2015, from 2,000 morning peak-hour passengers to more than 2,700. Peak-direction transbay ridership is at 93 percent of seated capacity.
- Caltrain: Caltrain’s daily ridership doubled in the last 10 years, from 26,500 in 2005 to more than 58,000 in 2015. The 10 highest-demand trains operated by Caltrain in each direction now have ridership exceeding 100 percent of seated capacity, with the busiest trains exceeding 120 percent of seated capacity. Caltrain projects average weekday ridership will grow by more than a third by 2021, to 83,000.
- Water Emergency Transportation Authority (WETA): Ridership on the region’s ferries grew from roughly 3,500 average weekday passengers in the 2009-10 fiscal year to more than 6,200 in 2013-14.
Although there are many planned improvements to help alleviate crowding and improve system efficiency — including vehicle replacement and expansion, new technologies and control systems, new facilities and infrastructure, and new transit routes and services — not all of these improvements are fully funded, and physical and structural constraints remain that will make accommodating anticipated future ridership growth difficult without additional transportation investments.
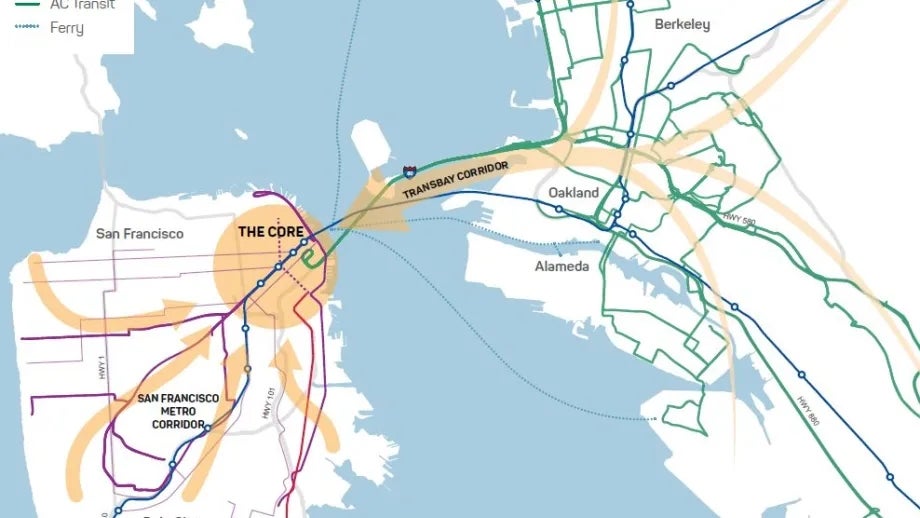
Transbay Corridor Capacity and Potential Growth in Travel Demand
Click here to view this image as a stand-alone PDF.
For example, BART is hampered by speed restrictions and congestion in the Oakland “Wye” (where all BART lines converge at a point just east of West Oakland Station), and by major systemwide delays when there are issues or maintenance needs in the Transbay Tube. Congestion on Bay Bridge onramps and mixed traffic on the Bay Bridge slow transbay buses, while downtown San Francisco rail stations such as Mongtomery and Embarcadero are already at maximum capacity during peak hours and congestion on Market Street interferes with Muni buses. In fact, two out of every three BART trips begin or end on Market Street in downtown San Francisco.
“This report provides a comprehensive picture of both the challenges to delivering more transit options for people who commute into San Francisco’s employment centers as well as insights into potential opportunities,” said Randy Rentschler, director of Legislation and Public Affairs for MTC.
The graphic below summarizes the full list of constraints currently faced by the Bay Area’s public transit system.
Summarizing Constraints on the Bay Area’s Public Transit System
Click here to view this image as a stand-alone PDF.
Over the next several months, the study will consider and evaluate additional short-, medium- and long-term investments that could help upgrade the transportation system and keep pace with anticipated growth over the next 25 years. The projects developed and prioritized through the Core Capacity Transit Study will be incorporated into the full list of priorities for the nine-county region in Plan Bay Area 2040, an update to the region’s long-term land use plan.
The Core Capacity Transit Study is a multi-agency effort by led MTC and includes AC Transit, BART, Caltrain, San Francisco Municipal Transportation Agency, San Francisco County Transportation Authority and WETA.
For additional information, read the Core Capacity Transit Study: Briefing Book, or visit the Core Capacity Transit Study page on MTC’s website.
Submit your comment
In order to receive a reply to your comment, please provide an email address.


Building a bay crossing (tunnel/) for high-speed rail that then follows the Capitol Corridor route would provide fast access to commuters from the Fairfield/Vacaville area and beyond to both SF and Silicon Valley job markets, and take many passengers off the Pittsburg/Bay Point BART line, as well as the Richmond line. Building another BART tube makes no sense when this would provide faster service in an existing upgraded corridor. .