Each month a new map is presented to the Commission to help explain important trends in the Bay Area, across the nation and around the world. These custom-crafted maps are prepared by MTC’s Data & Visualization team.
Each month a new map is presented to the Commission to help explain important trends in the Bay Area, across the nation and around the world. These custom-crafted maps are prepared by MTC’s Data & Visualization team.

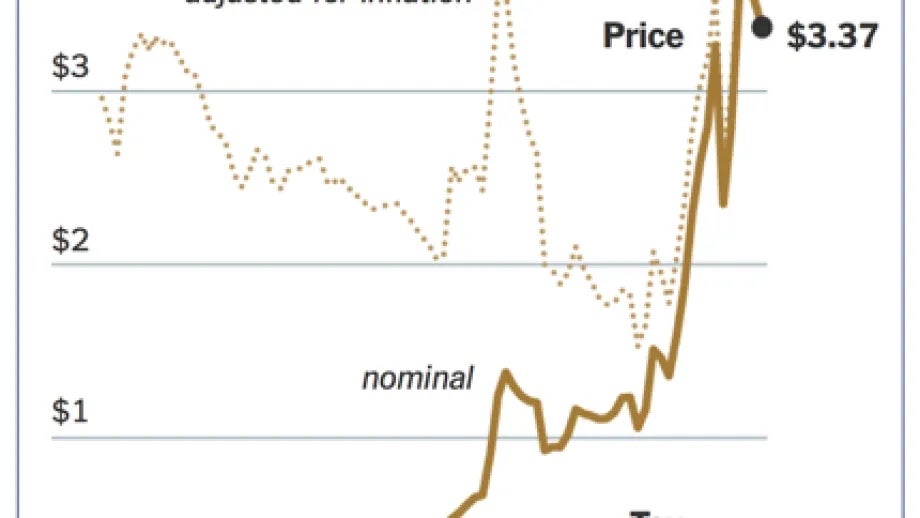
This month's chart highlights the growing divide between the price of gas and the taxes imposed for its use. When gasoline topped $4 a gallon, opponents of an increase in the gas tax argued that prices were already too high. Now that the average price of regular gas has dropped to under $2.50 a gallon, the anti-tax environment that pervades Washington shows little support for increasing the gas tax to finance the upkeep of the nation's roadways and public transit systems. This no-win dynamic is frustrating to advocates who had hoped falling gas prices might reinvigorate the idea of raising the gas tax, which they view as one of the simplest, fairest and most efficient ways to pay for transportation repairs and improvements. The latest discussions about raising the gas tax come as the Energy Information Administration estimates that the average American household will spend at least $550 less on gasoline next year than it did in 2014, a result of lower prices and more fuel-efficient cars and trucks that can travel farther on fewer gallons. The last time the gasoline tax was raised was in 1993, and even that 4.3-cent-a-gallon increase was not initially dedicated to transportation repair and capital improvements, but rather was part of President Clinton's budget-deficit reduction plan. That revenue stream was redirected to the federal Highway Trust Fund in 1997 Back then, the 18.4-cent tax on every gallon represented about 16 percent of the pump price. If the gas tax had kept pace with inflation it would be 30.1 cents today. The Trust Fund now faces a major decline of an estimated $160 billion deficit over the next 10 years.