Each month a new map is presented to the Commission to help explain important trends in the Bay Area, across the nation and around the world. These custom-crafted maps are prepared by MTC’s Data & Visualization team.
Each month a new map is presented to the Commission to help explain important trends in the Bay Area, across the nation and around the world. These custom-crafted maps are prepared by MTC’s Data & Visualization team.

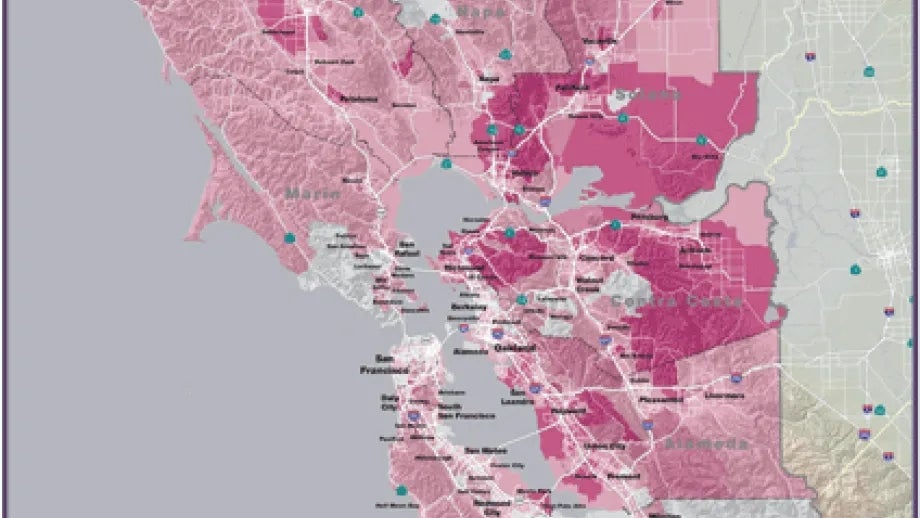
The map of the month shows the total owner-occupied foreclosures within the Bay Area by census tract between July 2008 and June 2009. Foreclosure types considered for this analysis include lender owned and third-party owned foreclosures as well as foreclosed properties ready for auction. Contra Costa and Solano counties showed the highest foreclosure rates in the Bay Area during the first half of 2009 with up to 170 foreclosures per tract.