Each month a new map is presented to the Commission to help explain important trends in the Bay Area, across the nation and around the world. These custom-crafted maps are prepared by MTC’s Data & Visualization team.
Each month a new map is presented to the Commission to help explain important trends in the Bay Area, across the nation and around the world. These custom-crafted maps are prepared by MTC’s Data & Visualization team.

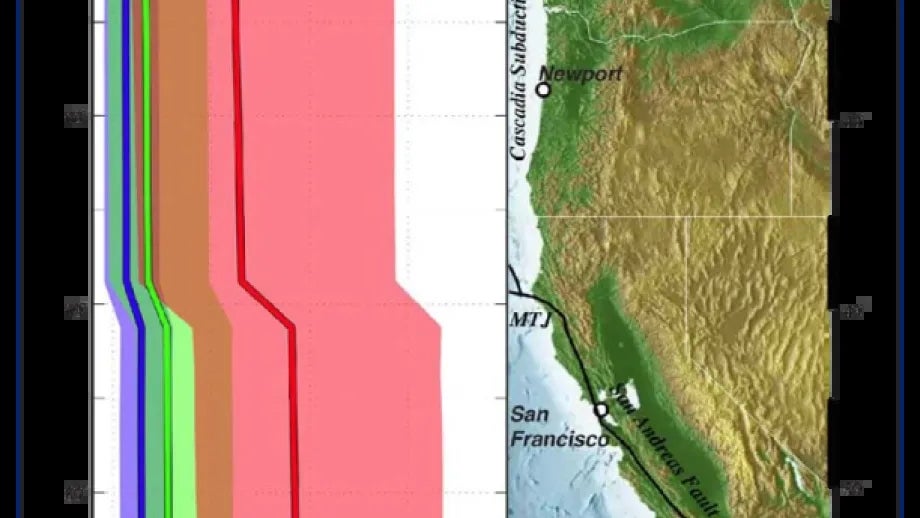
This map illustrates the total regional sea level projected for the years 2030, 2050, and 2100, relative to year 2000, for a transect along the west coast. The shape of the curve is dominated by the change in vertical land motion at about 40 degrees latitude from uplift in the north to subsidence in the south. The sea-level fingerprint effect reduces the projected sea levels along the entire coast and is most pronounced in Washington. Projected sea-level rise off California, Oregon, and Washington for 2030 (blue), 2050 (green), and 2100 (pink), relative to 2000, as a function of latitude. Solid lines are the projections and shaded areas are the ranges. Ranges overlap, as indicated by the brown shading (low end of 2100 range and high end of 2050 range) and blue-green shading (low end of 2050 range and high end of 2030 range). MTJ = Mendocino Triple Junction, where the San Andreas Fault meets the Cascadia Subduction Zone.