Each month a new map is presented to the Commission to help explain important trends in the Bay Area, across the nation and around the world. These custom-crafted maps are prepared by MTC’s Data & Visualization team.
Each month a new map is presented to the Commission to help explain important trends in the Bay Area, across the nation and around the world. These custom-crafted maps are prepared by MTC’s Data & Visualization team.

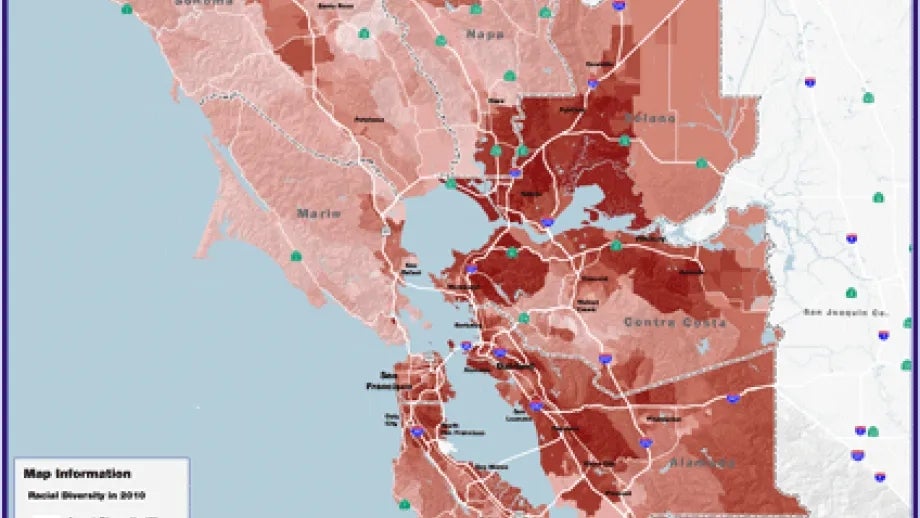
This map illustrates the racial and ethnic diversity in the Bay Area from Census 2010. Racial diversity is measured by a diversity index that is calculated using US Census racial and ethnic population characteristics from the PL-94 data file. The diversity index is a quantitative measure of the distribution of the proportion of five major ethnic populations (non-Hispanic White, non-Hispanic Black, Asian and Pacific Islander, Hispanic, and Two or more races). The index ranges from 0 (low diversity meaning only one group is present) to 1 (meaning an equal proportion of all five groups is present). The diversity score for the United States in 2010 is 0.60. The diversity score for the Bay Area is 0.84. Within the Bay Area, Solano (0.89) and Alameda (0.90) Counties are the most diverse and the remaining North Bay (0.55 - 0.64) Counties are the least diverse.