Each month a new map is presented to the Commission to help explain important trends in the Bay Area, across the nation and around the world. These custom-crafted maps are prepared by MTC’s Data & Visualization team.
Each month a new map is presented to the Commission to help explain important trends in the Bay Area, across the nation and around the world. These custom-crafted maps are prepared by MTC’s Data & Visualization team.

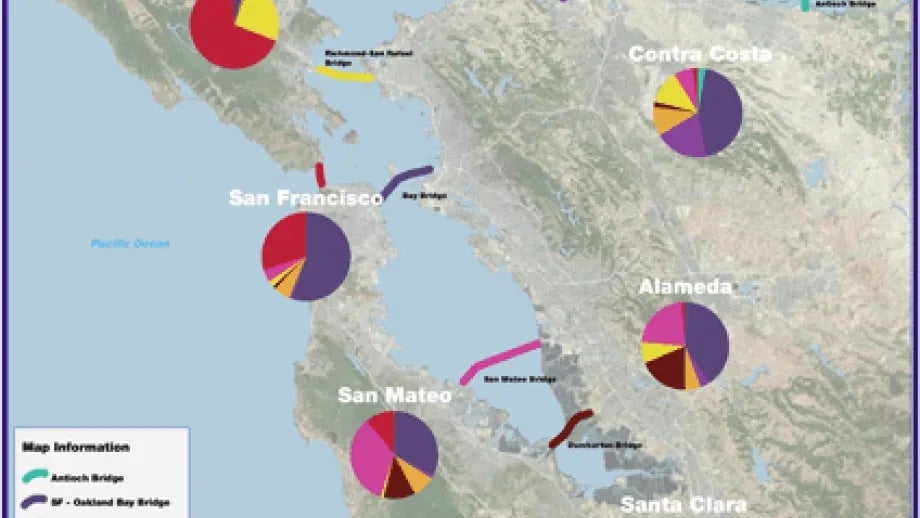
This map shows the distribution of FasTrak toll crossings generated by each county in the Bay Area. As expected, the distribution generally shows that counties closest to a bridge account for a greater share of FasTrak usage. However, some toll crossings – such as the Golden Gate and Bay Bridges – draw a significant share of users from distant counties. For instance, 32% of FasTrak customers from San Mateo County use the Bay Bridge, while 11% of both San Mateo and Santa Clara County customers use the Golden Gate Bridge.