Monthly Transportation Statistics
The data below reflect monthly vehicle traffic and public transit ridership numbers from 2019 to the present.
To estimate the number of cars on the road and the number of passengers riding public transit, below are charts that show how many vehicles used Bay Area bridges, how many trips were taken in the BART system, and how many Clipper® cards were used each month, starting in January 2019.
These figures are intended to serve as a proxy to show the increase (or decrease) in traffic and ridership volumes. In all toll bridge figures, the data show vehicle crossings in the toll direction only. BART ridership is represented by the average of weekday exits from all stations.
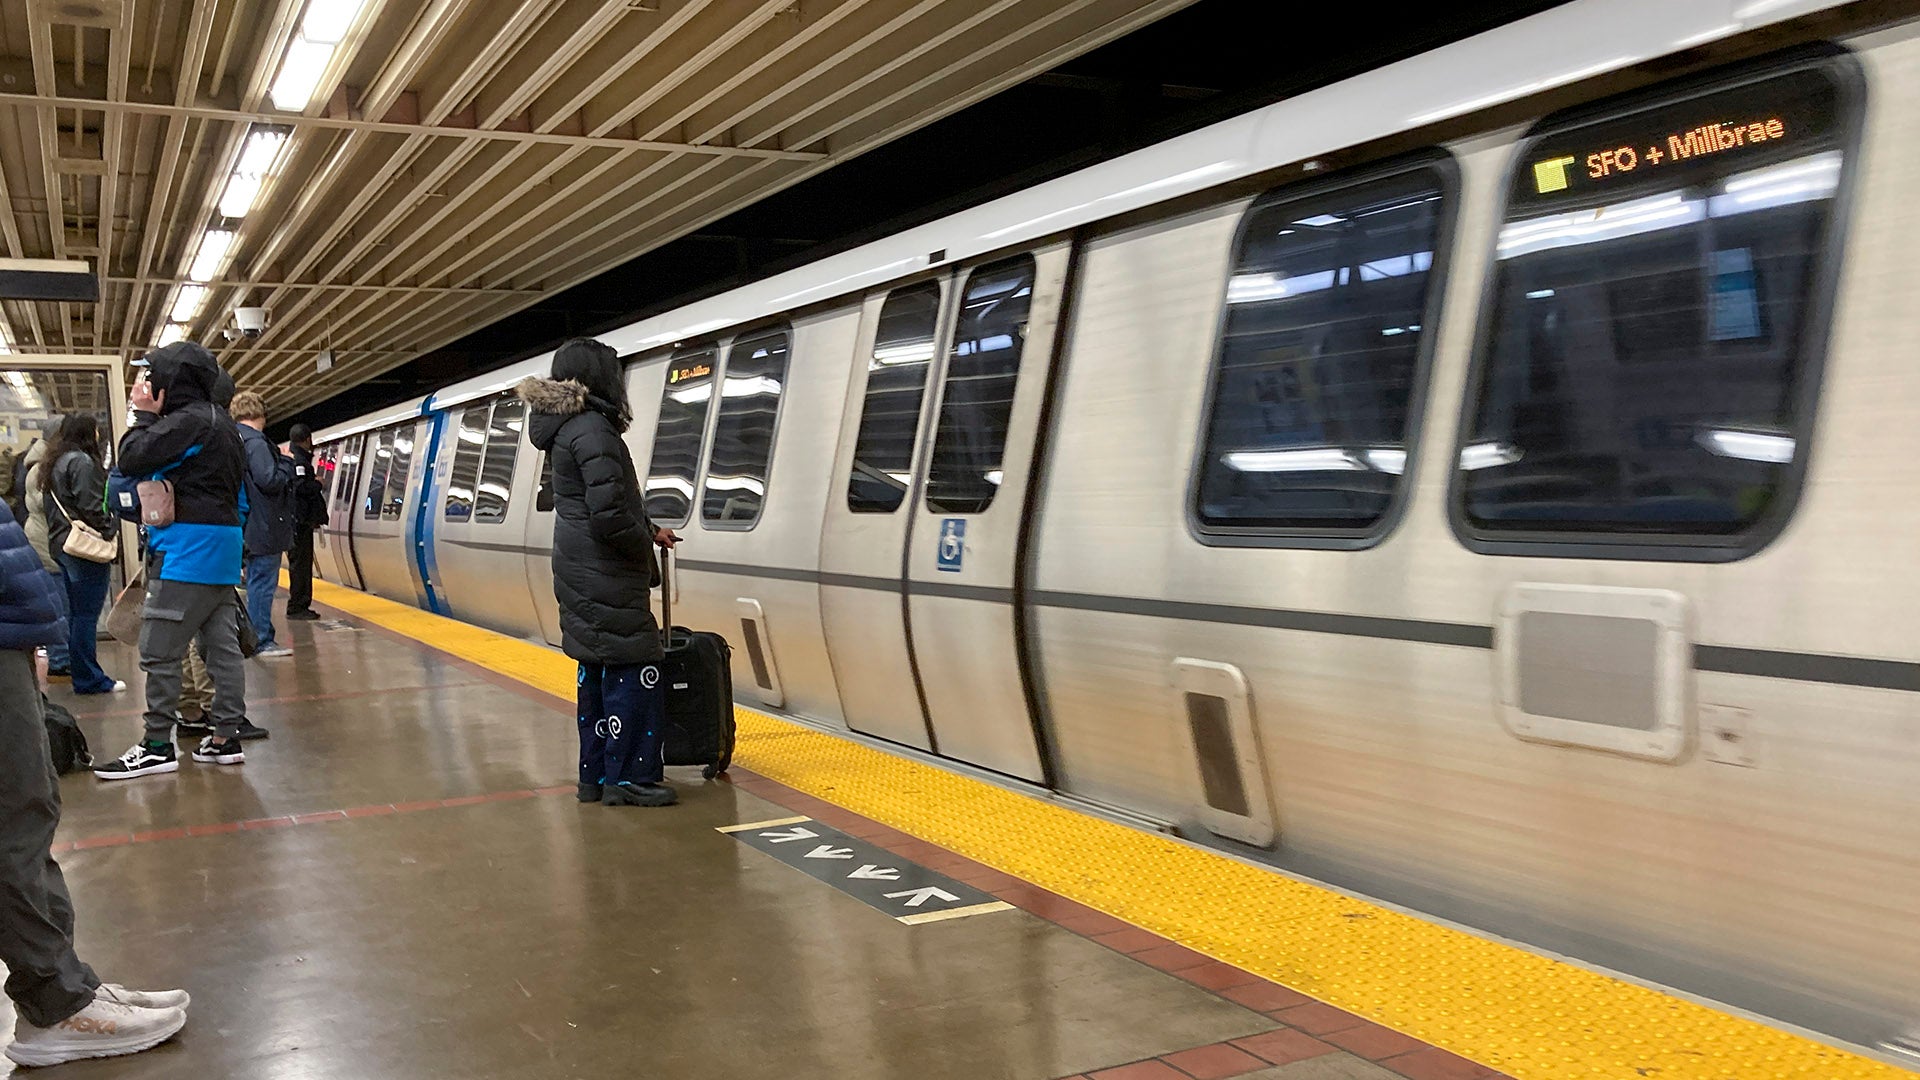
Transit
BART Ridership
The average weekday BART station exits.
| Month/Year | 2019 | 2020 | 2021 | 2022 | 2023 | 2024 | 2025 | 2026 |
|---|---|---|---|---|---|---|---|---|
| January | 395,860 | 388,910 | 43,012 | 85,463 | 134,140 | 151,854 | 162,938 | 170,543 |
| February | 407,337 | 404,552 | 47,665 | 105,374 | 151,390 | 162,186 | 171,856 | 178,379 |
| March | 409,515 | 166,574 | 51,596 | 124,094 | 151,150 | 162,459 | 174,538 | 188,231 |
| April | 414,397 | 25,136 | 57,886 | 132,181 | 159,696 | 163,267 | 181,466 | 201,256 |
| May | 412,165 | 29,878 | 64,934 | 135,824 | 159,918 | 168,356 | 170,293 | 196,692 |
| June | 413,521 | 40,979 | 75,963 | 140,564 | 158,361 | 164,743 | 183,481 | 206,689 |
| July | 401,465 | 45,633 | 85,291 | 133,858 | 154,825 | 159,220 | 172,984 | |
| August | 410,854 | 46,020 | 92,402 | 144,008 | 166,637 | 165,764 | 186,515 | |
| September | 426,755 | 48,838 | 105,997 | 161,902 | 172,051 | 184,248 | 189,810 | |
| October | 420,277 | 53,255 | 109,781 | 159,099 | 171,277 | 180,834 | 196,331 | |
| November | 411,183 | 52,198 | 112,282 | 150,242 | 165,802 | 166,035 | 173,574 | |
| December | 376,551 | 45,893 | 102,993 | 130,283 | 144,070 | 156,466 | 159,537 |
Unique Clipper Cards Used
Figures below include both physical Clipper cards and digital Clipper cards.
Note: Figures from December 2025 onward may be elevated. Cards that transitioned from Clipper to Clipper 2 during recent months may have been counted twice.
| Month/Year | 2019 | 2020 | 2021 | 2022 | 2023 | 2024 | 2025 | 2026 |
|---|---|---|---|---|---|---|---|---|
| January | 1,142,433 | 1,316,389 | 251,567 | 619,896 | 931,450 | 1,062,669 | 1,167,516 | 1,136,375 |
| February | 1,114,616 | 1,290,866 | 275,592 | 696,988 | 951,011 | 1,056,880 | 1,119,866 | 1,103,197 |
| March | 1,186,880 | 929,117 | 327,052 | 845,803 | 1,023,040 | 1,128,543 | 1,205,160 | 1,224,401 |
| April | 1,209,878 | 132,165 | 396,139 | 924,212 | 1,072,327 | 1,150,696 | 1,276,954 | 1,174,122 |
| May | 1,224,052 | 128,085 | 478,589 | 986,216 | 1,099,155 | 1,237,490 | 1,346,331 | 1,233,672 |
| June | 1,239,978 | 185,054 | 580,373 | 1,071,592 | 1,134,944 | 1,232,367 | 1,368,967 | 1,226,207 |
| July | 1,217,592 | 199,714 | 670,735 | 994,075 | 1,118,764 | 1,200,151 | 1,344,706 | |
| August | 1,327,026 | 225,855 | 721,733 | 1,090,963 | 1,212,111 | 1,313,661 | 1,422,623 | |
| September | 1,372,036 | 251,336 | 737,339 | 1,117,425 | 1,162,105 | 1,319,338 | 1,282,586 | |
| October | 1,379,416 | 305,102 | 814,664 | 1,101,357 | 1,205,360 | 1,285,036 | 1,260,489 | |
| November | 1,345,028 | 302,316 | 788,839 | 1,007,699 | 1,125,241 | 1,169,590 | 1,217,155 | |
| December | 1,362,519 | 264,500 | 781,866 | 995,266 | 1,137,979 | 1,194,385 | 1,210,845 |
Unique Bank Cards Used
Tap and Ride was introduced on BART in August 2025 and available for other agencies starting in December 2025.
| Month/Year | 2025 | 2026 |
|---|---|---|
| January | N/A | 289,883 |
| February | N/A | 309,359 |
| March | N/A | 390,530 |
| April | N/A | 391,883 |
| May | N/A | 469,785 |
| June | N/A | 561,983 |
| July | N/A | |
| August | 68,784 | |
| September | 170,237 | |
| October | 183,928 | |
| November | 159,115 | |
| December | 259,995 |
Driving
FasTrak Accounts
The number of unique FasTrak accounts in use.
| Month/Year | 2019 | 2020 | 2021 | 2022 | 2023 | 2024 | 2025 | 2026 |
|---|---|---|---|---|---|---|---|---|
| January | 2,397,972 | 2,525,216 | 2,747,361 | 3,001,634 | 3,180,298 | 3,329,822 | 3,481,118 | 3,668,853 |
| February | 2,412,479 | 2,537,967 | 2,759,073 | 3,015,047 | 3,193,300 | 3,340,284 | 3,493,348 | 3,687,250 |
| March | 2,424,933 | 2,549,299 | 2,804,236 | 3,033,972 | 3,204,734 | 3,354,284 | 3,509,344 | 3,700,841 |
| April | 2,354,276 | 2,557,973 | 2,811,980 | 3,059,943 | 3,217,088 | 3,371,044 | 3,528,617 | 3,718,012 |
| May | 2,398,854 | 2,570,728 | 2,835,594 | 3,075,592 | 3,229,286 | 3,384,220 | 3,544,616 | 3,733,202 |
| June | 2,405,800 | 2,594,017 | 2,859,538 | 3,079,315 | 3,243,361 | 3,392,419 | 3,560,366 | 3,749,912 |
| July | 2,430,023 | 2,626,965 | 2,885,735 | 3,098,377 | 3,258,404 | 3,406,129 | 3,577,609 | |
| August | 2,439,637 | 2,656,740 | 2,914,140 | 3,115,082 | 3,275,346 | 3,419,667 | 3,599,298 | |
| September | 2,451,510 | 2,678,456 | 2,937,690 | 3,127,768 | 3,288,823 | 3,429,852 | 3,614,480 | |
| October | 2,461,065 | 2,699,207 | 2,956,919 | 3,144,427 | 3,298,923 | 3,440,681 | 3,614,480 | |
| November | 2,489,706 | 2,721,686 | 2,973,420 | 3,154,888 | 3,308,042 | 3,452,949 | 3,643,260 | |
| December | 2,506,723 | 2,730,221 | 2,986,581 | 3,155,709 | 3,316,856 | 3,461,836 | 3,652,908 |
San Francisco-Oakland Bay Bridge Crossings
One-way toll crossings for the Bay Bridge.
| Month/Year | 2019 | 2020 | 2021 | 2022 | 2023 | 2024 | 2025 | 2026 |
|---|---|---|---|---|---|---|---|---|
| January | 3,913,767 | 3,878,683 | 3,041,330 | 3,325,322 | 3,383,633 | 3,462,422 | 3,527,140 | 3,493,358 |
| February | 3,587,902 | 3,722,539 | 2,989,816 | 3,286,568 | 3,199,618 | 3,332,318 | 3,239,106 | 3,263,952 |
| March | 4,058,925 | 2,882,649 | 3,532,498 | 3,717,879 | 3,568,295 | 3,650,729 | 3,641,671 | 3,664,123 |
| April | 3,976,731 | 1,996,243 | 3,522,492 | 3,634,689 | 3,649,730 | 3,650,435 | 3,610,238 | 3,510,030 |
| May | 4,040,558 | 2,673,380 | 3,671,838 | 3,729,564 | 3,763,446 | 3,706,897 | 3,702,144 | 3,659,694 |
| June | 4,006,902 | 3,036,424 | 3,673,837 | 3,622,401 | 3,673,225 | 3,619,233 | 3,581,985 | 3,585,866 |
| July | 4,063,748 | 3,294,706 | 3,803,940 | 3,739,359 | 3,711,557 | 3,710,452 | 3,687,703 | |
| August | 4,113,916 | 3,382,756 | 3,737,917 | 3,803,975 | 3,795,223 | 3,754,439 | 3,703,249 | |
| September | 3,948,426 | 3,282,056 | 3,618,241 | 3,649,505 | 3,613,710 | 3,597,563 | 3,547,272 | |
| October | 4,047,327 | 3,504,554 | 3,700,292 | 3,754,261 | 3,686,944 | 3,705,411 | 3,691,034 | |
| November | 3,847,809 | 3,192,647 | 3,546,027 | 3,513,877 | 3,399,365 | 3,439,752 | 3,477,742 | |
| December | 3,882,964 | 3,111,694 | 3,529,143 | 3,513,520 | 3,573,283 | 3,559,559 | 3,551,661 | |
| Annual Total | 47,488,975 | 37,958,331 | 42,367,371 | 43,290,920 | 43,018,029 | 43,189,201 | 42,960,945 |
Other State Bridge Crossings
Combined, one-way toll crossings for the Antioch, Benicia-Martinez, Carquinez, Dumbarton, Richmond-San Rafael and San Mateo-Hayward bridges.
| Month/Year | 2019 | 2020 | 2021 | 2022 | 2023 | 2024 | 2025 | 2026 |
|---|---|---|---|---|---|---|---|---|
| January | 7,538,500 | 7,568,435 | 5,521,839 | 6,025,847 | 5,769,969 | 6,485,811 | 6,697,741 | 6,703,417 |
| February | 6,910,031 | 7,343,547 | 5,599,047 | 6,036,446 | 5,364,167 | 6,304,254 | 6,118,931 | 6,289,393 |
| March | 8,017,445 | 5,491,765 | 6,559,287 | 6,853,492 | 6,454,883 | 6,972,065 | 7,053,303 | 7,285,605 |
| April | 7,920,998 | 2,617,992 | 6,620,209 | 6,708,990 | 6,974,515 | 6,975,523 | 6,632,948 | 6,918,749 |
| May | 8,201,831 | 4,745,633 | 7,062,323 | 6,956,649 | 7,386,349 | 7,397,319 | 7,475,575 | 7,413,308 |
| June | 8,202,155 | 5,856,837 | 7,126,052 | 6,847,223 | 7,351,625 | 7,161,128 | 7,224,991 | 7,361,249 |
| July | 8,377,614 | 6,290,371 | 7,357,246 | 6,902,801 | 7,327,483 | 7,284,249 | 7,450,398 | |
| August | 8,549,843 | 6,260,897 | 7,171,602 | 7,139,527 | 7,452,672 | 7,436,801 | 7,517,186 | |
| September | 7,959,496 | 6,111,347 | 6,941,161 | 6,864,207 | 6,972,622 | 7,025,961 | 7,123,664 | |
| October | 8,136,759 | 5,533,549 | 7,022,015 | 7,114,002 | 7,192,921 | 7,373,720 | 7,376,161 | |
| November | 7,614,328 | 5,887,519 | 6,801,585 | 6,599,555 | 6,775,420 | 6,696,982 | 6,767,525 | |
| December | 7,551,545 | 5,737,554 | 6,667,872 | 6,465,731 | 6,656,119 | 6,745,460 | 6,857,965 | |
| Annual Total | 94,980,545 | 69,445,446 | 80,450,238 | 80,514,470 | 81,678,745 | 83,859,273 | 84,296,388 |
Annual Total Bridge Traffic
Annual total of one-way toll transactions for each of the Bay Area's state-owned bridges.
| Bridge/Year | 2019 | 2020 | 2021 | 2022 | 2023 | 2024 | 2025 |
|---|---|---|---|---|---|---|---|
| Antioch | 3,284,687 | 2,824,464 | 3,233,924 | 3,231,873 | 3,287,740 | 3,310,904 | 3,303,547 |
| Benicia-Martinez | 21,734,702 | 16,899,545 | 19,602,480 | 18,265,371 | 19,662,706 | 19,602,485 | 19,935,343 |
| Carquinez | 22,768,166 | 19,195,910 | 21,016,754 | 20,794,085 | 20,450,058 | 20,776,010 | 20,582,454 |
| Dumbarton | 12,278,431 | 7,698,077 | 8,420,252 | 9,328,825 | 9,853,853 | 10,202,488 | 10,359,919 |
| Richmond-San Rafael | 14,753,058 | 11,479,902 | 13,028,136 | 13,138,978 | 12,800,461 | 13,345,483 | 13,423,251 |
| San Francisco-Oakland | 47,488,978 | 37,958,337 | 42,367,423 | 43,290,931 | 42,986,208 | 43,007,927 | 42,960,953 |
| San Mateo-Hayward | 20,161,570 | 13,428,658 | 15,082,680 | 15,755,362 | 15,649,973 | 16,523,983 | 17,102,113 |
| Annual Totals | 142,469,592 | 109,484,893 | 122,751,649 | 123,805,425 | 124,690,999 | 126,769,280 | 127,667,580 |
Freeway Service Patrol Assists
The number of assists by the Freeway Service Patrol.
| Month/Year | 2019 | 2020 | 2021 | 2022 | 2023 | 2024 | 2025 | 2026 |
|---|---|---|---|---|---|---|---|---|
| January | 6,724 | 7,917 | 3,890 | 5,164 | 4,736 | 7,265 | 6,701 | 7,155 |
| February | 6,143 | 7,136 | 3,809 | 5,013 | 4,268 | 7,489 | 6,313 | 8,247 |
| March | 7,006 | 7,791 | 5,179 | 5,710 | 5,279 | 8,093 | 6,794 | 9,186 |
| April | 7,439 | 5,540 | 4,880 | 5,314 | 4,805 | 8,040 | 6,907 | 9,018 |
| May | 7,760 | 5,987 | 4,548 | 6,017 | 5,100 | 9,007 | 7,387 | 7,595 |
| June | 7,349 | 6,862 | 5,264 | 5,982 | 4,766 | 7,187 | 6,960 | 6,241 |
| July | 8,599 | 4,748 | 5,866 | 5,447 | 4,336 | 8,220 | 7,690 | |
| August | 9,690 | 4,376 | 6,150 | 5,546 | 6,359 | 8,530 | 8,035 | |
| September | 8,846 | 4,370 | 5,842 | 5,396 | 6,103 | 8,614 | 7,410 | |
| October | 9,933 | 4,764 | 6,352 | 6,325 | 7,132 | 8,546 | 8,293 | |
| November | 7,497 | 3,971 | 5,291 | 4,777 | 6,676 | 5,451 | 6,484 | |
| December | 6,058 | 3,585 | 4,818 | 4,198 | 5,836 | 5,195 | 6,484 |
Freeway Service Patrol Wait Times
The average wait time (in minutes) for assists from the Freeway Service Patrol.
| Month/Year | 2019 | 2020 | 2021 | 2022 | 2023 | 2024 | 2025 | 2026 |
|---|---|---|---|---|---|---|---|---|
| January | 10.2 | 11.7 | 7.8 | 10.56 | 14.55 | 10.54 | 10.85 | 10.67 |
| February | 10.9 | 10.6 | 7.2 | 10.01 | 9.83 | 11.79 | 10.69 | 10.30 |
| March | 11.5 | 8.8 | 7.2 | 11.12 | 11.38 | 10.96 | 10.94 | 15.25 |
| April | 9.7 | 9.2 | 8.5 | 10.33 | 8.69 | 11.61 | 9.50 | 8.72 |
| May | 10.5 | 8.2 | 11.1 | 9.23 | 9.52 | 11.54 | 13.13 | 11.41 |
| June | 11.6 | 10.1 | 11.6 | 10.9 | 10.11 | 9.76 | 15.72 | 10.69 |
| July | 11.5 | 9.3 | 9 | 14.86 | 11.82 | 11.78 | 9.88 | |
| August | 10.9 | 10 | 9.23 | 11.51 | 12.54 | 14.99 | 10.64 | |
| September | 11.2 | 9.5 | 9.33 | 11.54 | 12.08 | 9.71 | 10.72 | |
| October | 11.5 | 10.6 | 11.54 | 14.39 | 13.09 | 12.38 | 10.70 | |
| November | 9.3 | 12.9 | 9.47 | 10.42 | 11.39 | 11.14 | 11.15 | |
| December | 11.2 | 10.6 | 9.7 | 7.65 | 13.01 | 12.75 | 11.12 |
The Bay Area Council's interactive graph highlights current bridge crossing data compared to pre-pandemic levels.
